Optimization Result #12
← All results
2026-07-09 03:54 · hill_climbing · model model_20260709_034954 · ran for 5.1s · 500 candidates
Objective comparison is available with Grid Search — this run used hill_climbing, so only its own winner is shown.
Winner — Max Total Profit
Tune in Simulator →
$92,069.66
Profit
39.3%
Margin
46.2%
This Event's Fill
42.0%
Next-Event Fill
Best Plan
| Event Date | Thu, Jul 16 2026 — 7:00 PM |
| Duration | 5.1 hours |
| Venue | Stadium Arena · $50,000.00 rental · 4000 capacity |
| Ticket Price | $126.94 |
| Predicted Attendance | 1845 tickets (46% of capacity) |
| Catering | $25.00 per head |
| Marketing Budget | $27,094.79 |
| Entertainment | $3,500.00 |
| Production | $2,500.00 |
| Logistics | $11,500.00 |
| Quality Improvements | $0.00 |
| Next-Event Fill | 42.0% — the reputation this plan builds for the venue's next event |
P&L Breakdown
| Venue Cost | $50,000.00 |
| Catering Cost | $46,125.00 |
| Entertainment Cost | $3,500.00 |
| Staffing Cost | $313.00 |
| Marketing Cost | $27,094.79 |
| Production Cost | $2,500.00 |
| Logistics Cost | $11,500.00 |
| Operational Cost | $1,100.00 |
| Quality Improvement Cost | $0.00 |
| Total Costs | $142,132.79 |
| Ticket Revenue | $234,202.46 |
| Gross Profit | $92,069.66 |
Parameter Importance
Average profit impact of changing each variable, measured around the run's own winner.
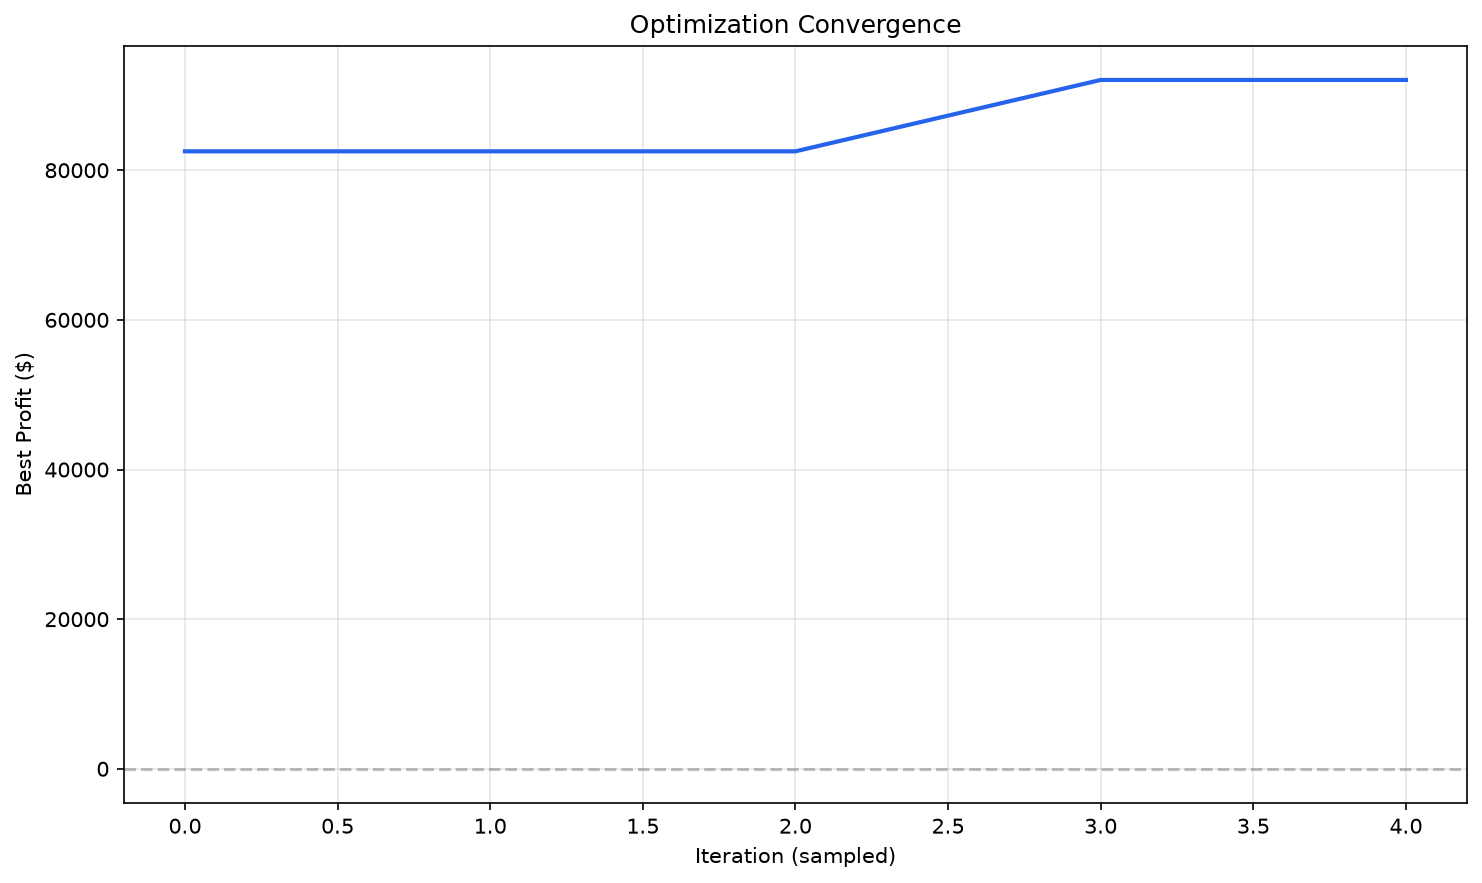
Convergence